A failure in F1 data analysis
The 2021 Saudia Arabian GP brake test
Click on the plot images to view the python script that generated them.
One of the many controversial moments of the 2021 F1 season came on the Saudi Arabian Grand Prix. During which, on the 37th lap, Lewis Hamilton ran into the back of Max Verstappen’s car. Lewis claimed that Verstappen had brake tested him, which is to say, had deliberately and abruptly reduced his speed while Lewis was closely behind. Earlier in that lap Lewis had attempted an overtake on Max and was forced wide at turn 1. This defense was seen as controversial by both Red Bull and Mercedes. Red Bull, anticipating an order (but without having received one) from the stewards, instructed Max to cede his position to Lewis strategically, in other words, to do so in a part of the track in which it would be easy for him to overtake Lewis immediately after. Max picked the appropriate place for this and slowed down significantly at said place expecting to be overtaken. Lewis, either confused by his slowing competitor (as he hadn’t been told that Max was ceding the position), or knowing that he would not be able to hold the position if he took it in that particular section, also slowed down and got close but remained behind Max, after which the alleged brake test and collision happened.
The FIA found Lewis to be correct and penalized Max for this. I’m interested in studying whether the justification provided by the FIA for the penalty given to Max after the incident can be verified using the telemetry that F1 makes available.
The claim is that Max experienced a deceleration of 2.4 G (1 G = 9.8 m/s²) as a consequence of braking suddenly [1]. And although not stated in these exact words on the FIA’s document regarding the incident and penalty, we can assume that the steward’s reasoning was that such a deceleration in that part of the track is abnormal during a racing lap, therefore was intentional. In theory we should be able to confirm this, given information about the speed Max's car during the lap, which we can obtain using the fastf1 python package by theOehrly [2].
As we can read from the FIA document [1], the incident occurred on turn 26. From the track layout available on wikipedia we can identify turn 26, and plotting the Red Bull’s velocity against it’s lap time as well as the lap time onto the track layout, we can determine the time of the lap that corresponds to turn 26 (circled in red).
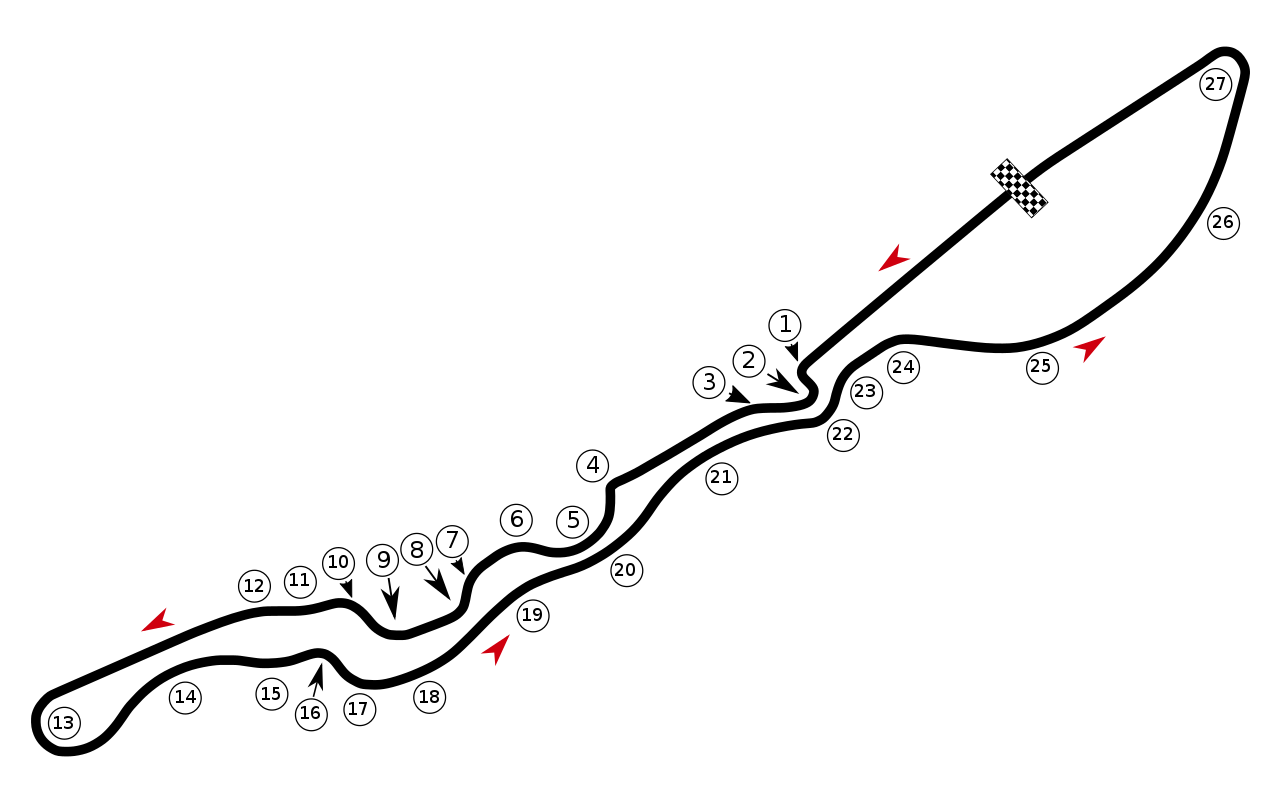
Layout of the Jeddah street circuit with turn numbers.
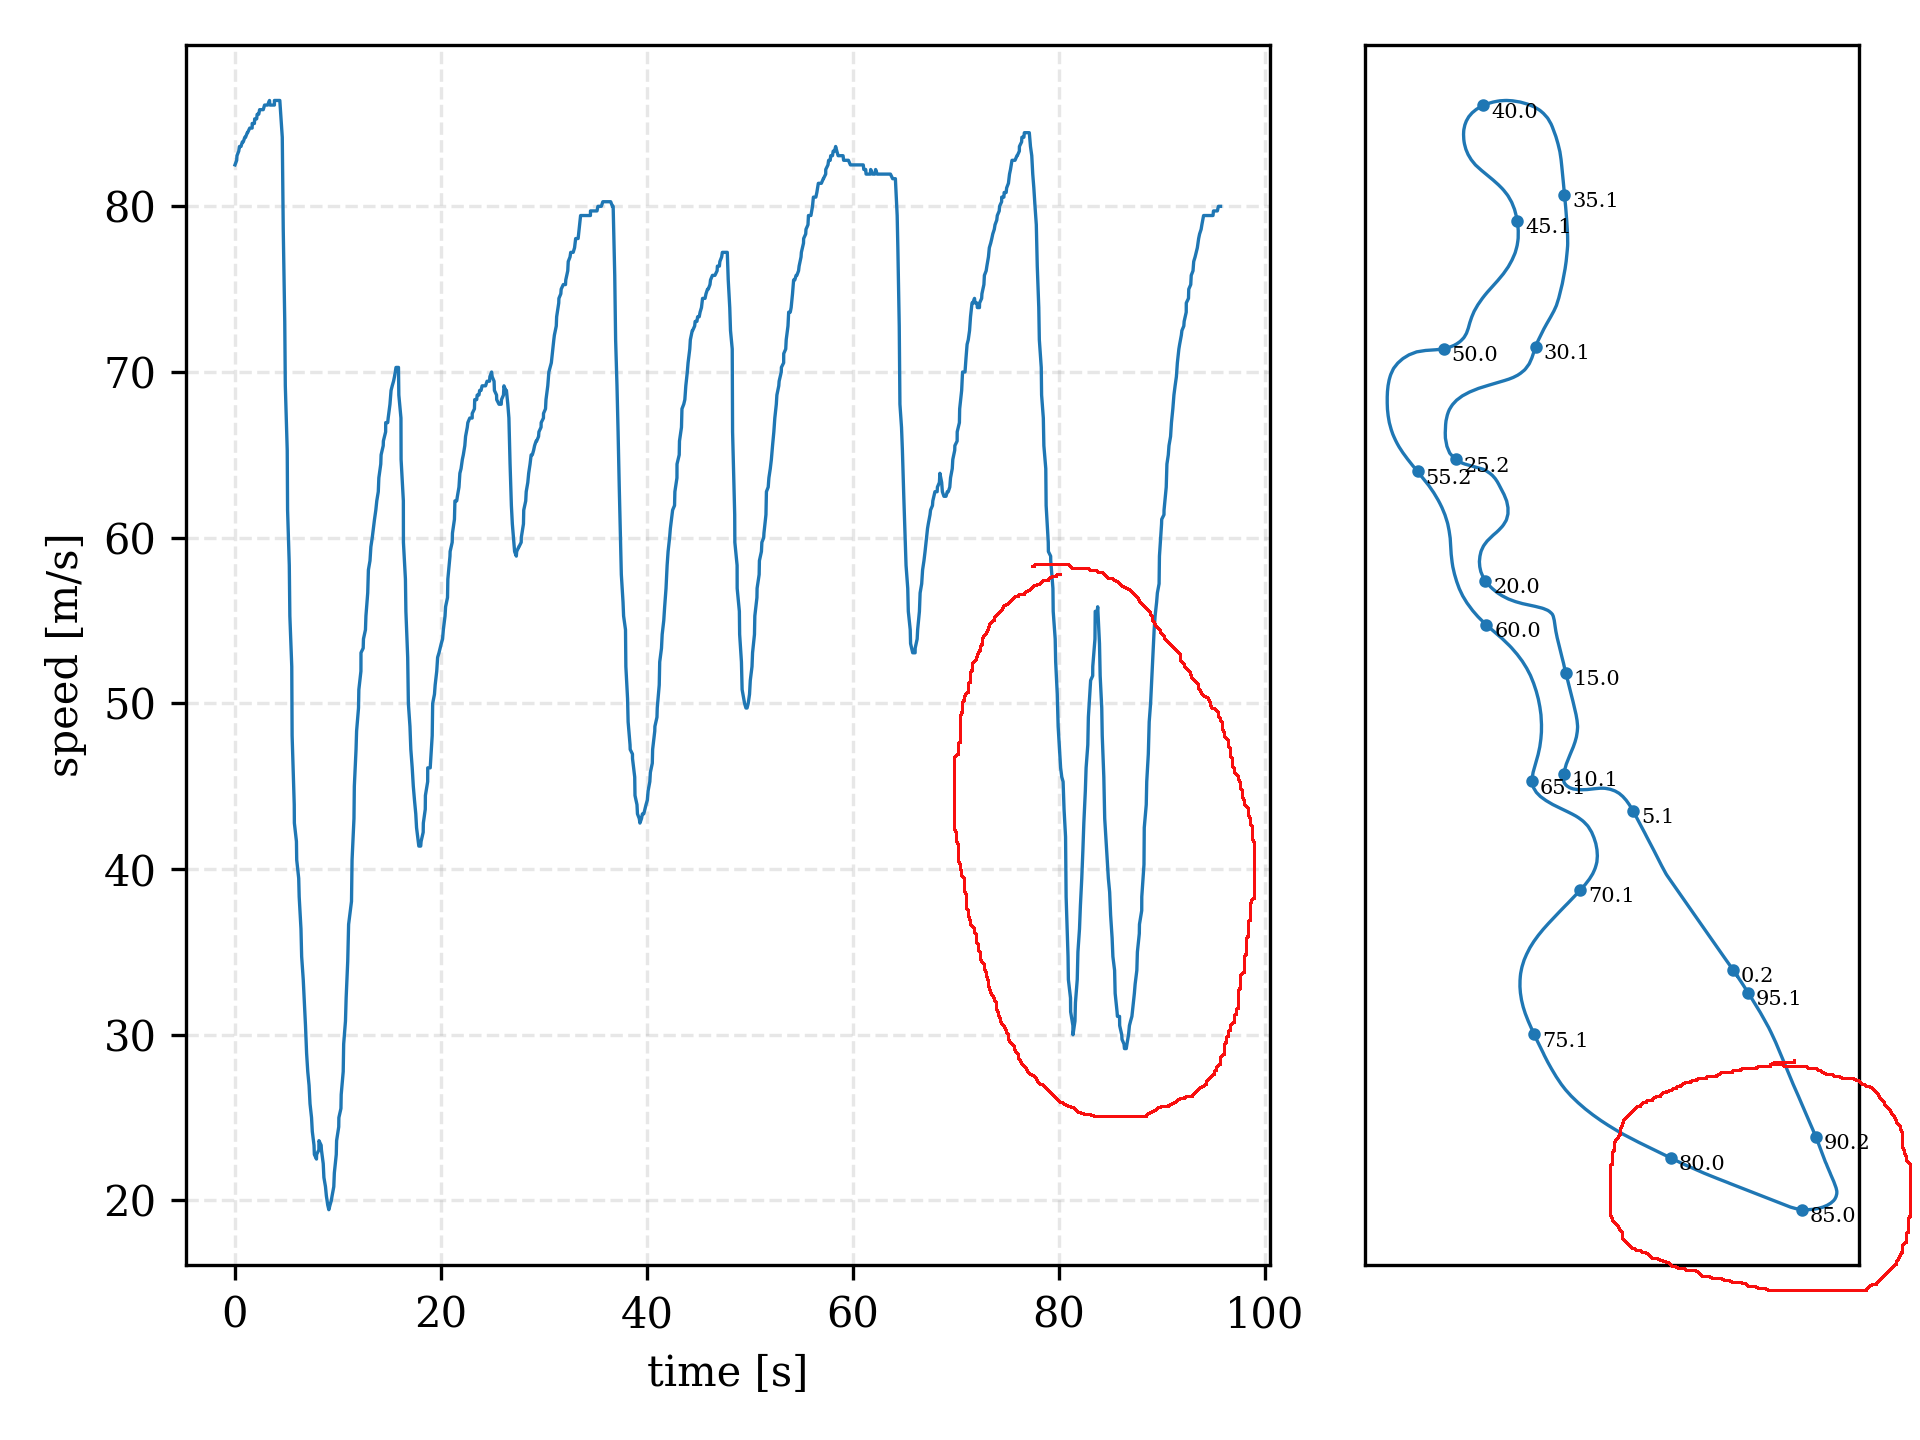
Plot of car 33's speed against it's lap time for lap 37 and the Jeddah circuit layout with lap time indicators.
Note that this particular lap of Max’s took a time of 1:37.056 to complete. This value was converted into seconds (97.056 s) for the purposes of plotting and the following calculations. Similarly the velocity of Max’s car was converted from [km/h] to [m/s]. The circled spike in speed corresponds to the penalized, presumably abnormal deceleration. For the sake of confirming this we plot Max’s speed on this lap (37) over his speed on an arbitrary previous uninterrupted (by a safety car) lap. For this purpose lap 19 was chosen.
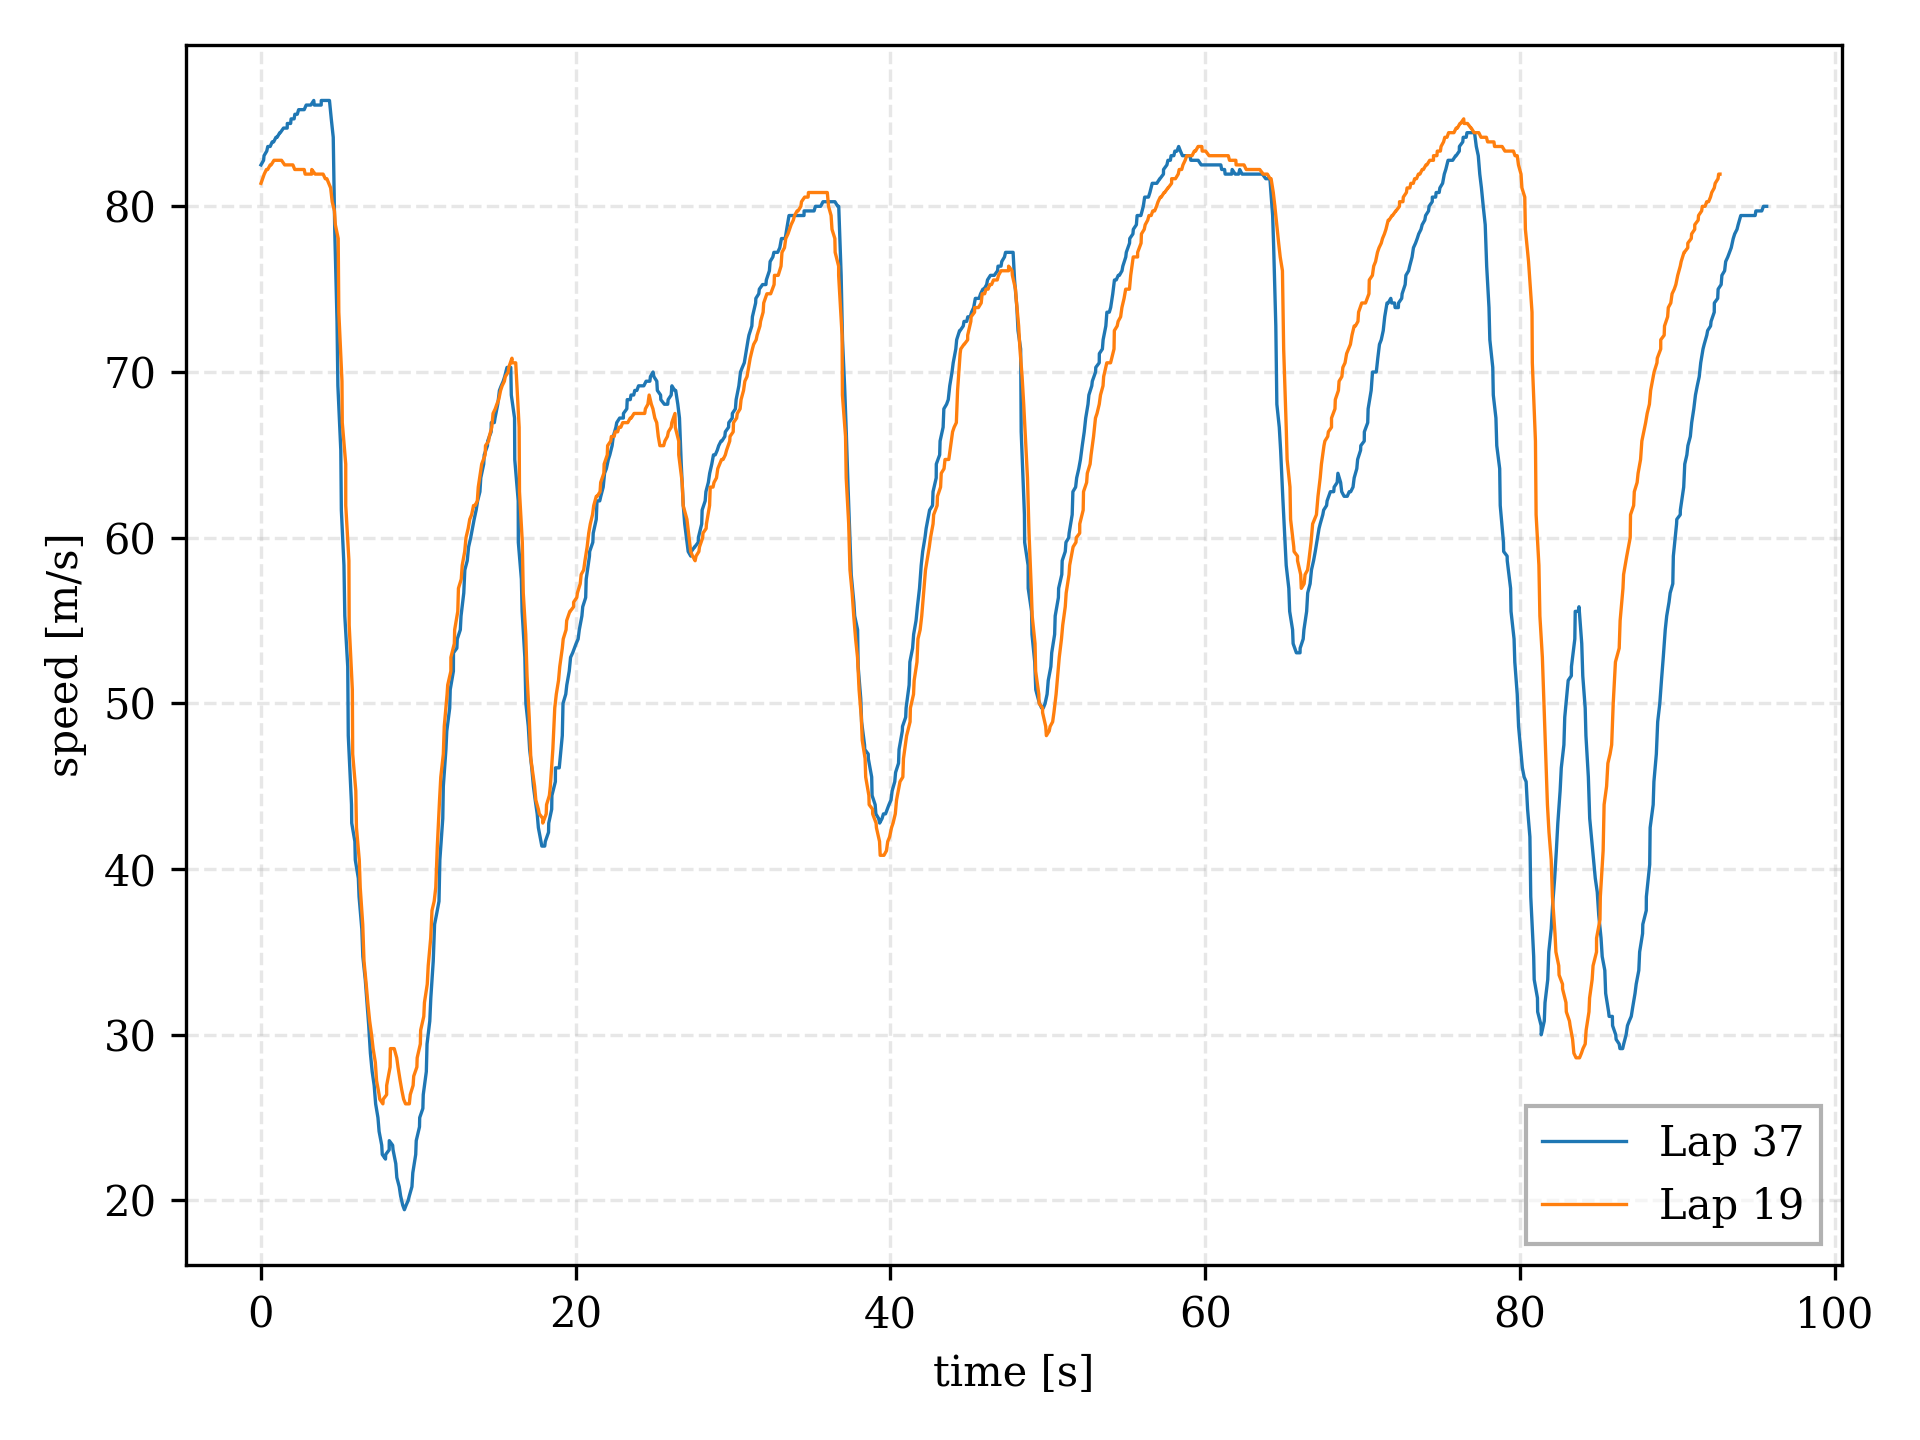
Comparison of laps 37 and lap 19.
Now, obviously lap 19 was faster than lap 37 by a few seconds, nevertheless it’s clear that the two curves follow roughly the same pattern for most of their lap times, and most importantly, the spike around the 80 second mark we are concerned with is not there on the lap 19 line. Furthermore, Max’s slowness after the 60 second mark is explained by him being instructed to cede his position strategically to Lewis, after his controversial defensive maneuver earlier in the lap.
Given this we are finally ready to determine and analyze Max’s acceleration throughout lap 37. With the information of Max’s speed and lap time we’ve essential got his speed as a function of time and performing a numeric differentiation on this data will provide us a similar acceleration curve for every moment of his lap. Specifically, this is done with the numpy.diff function. Here is the generated plot.
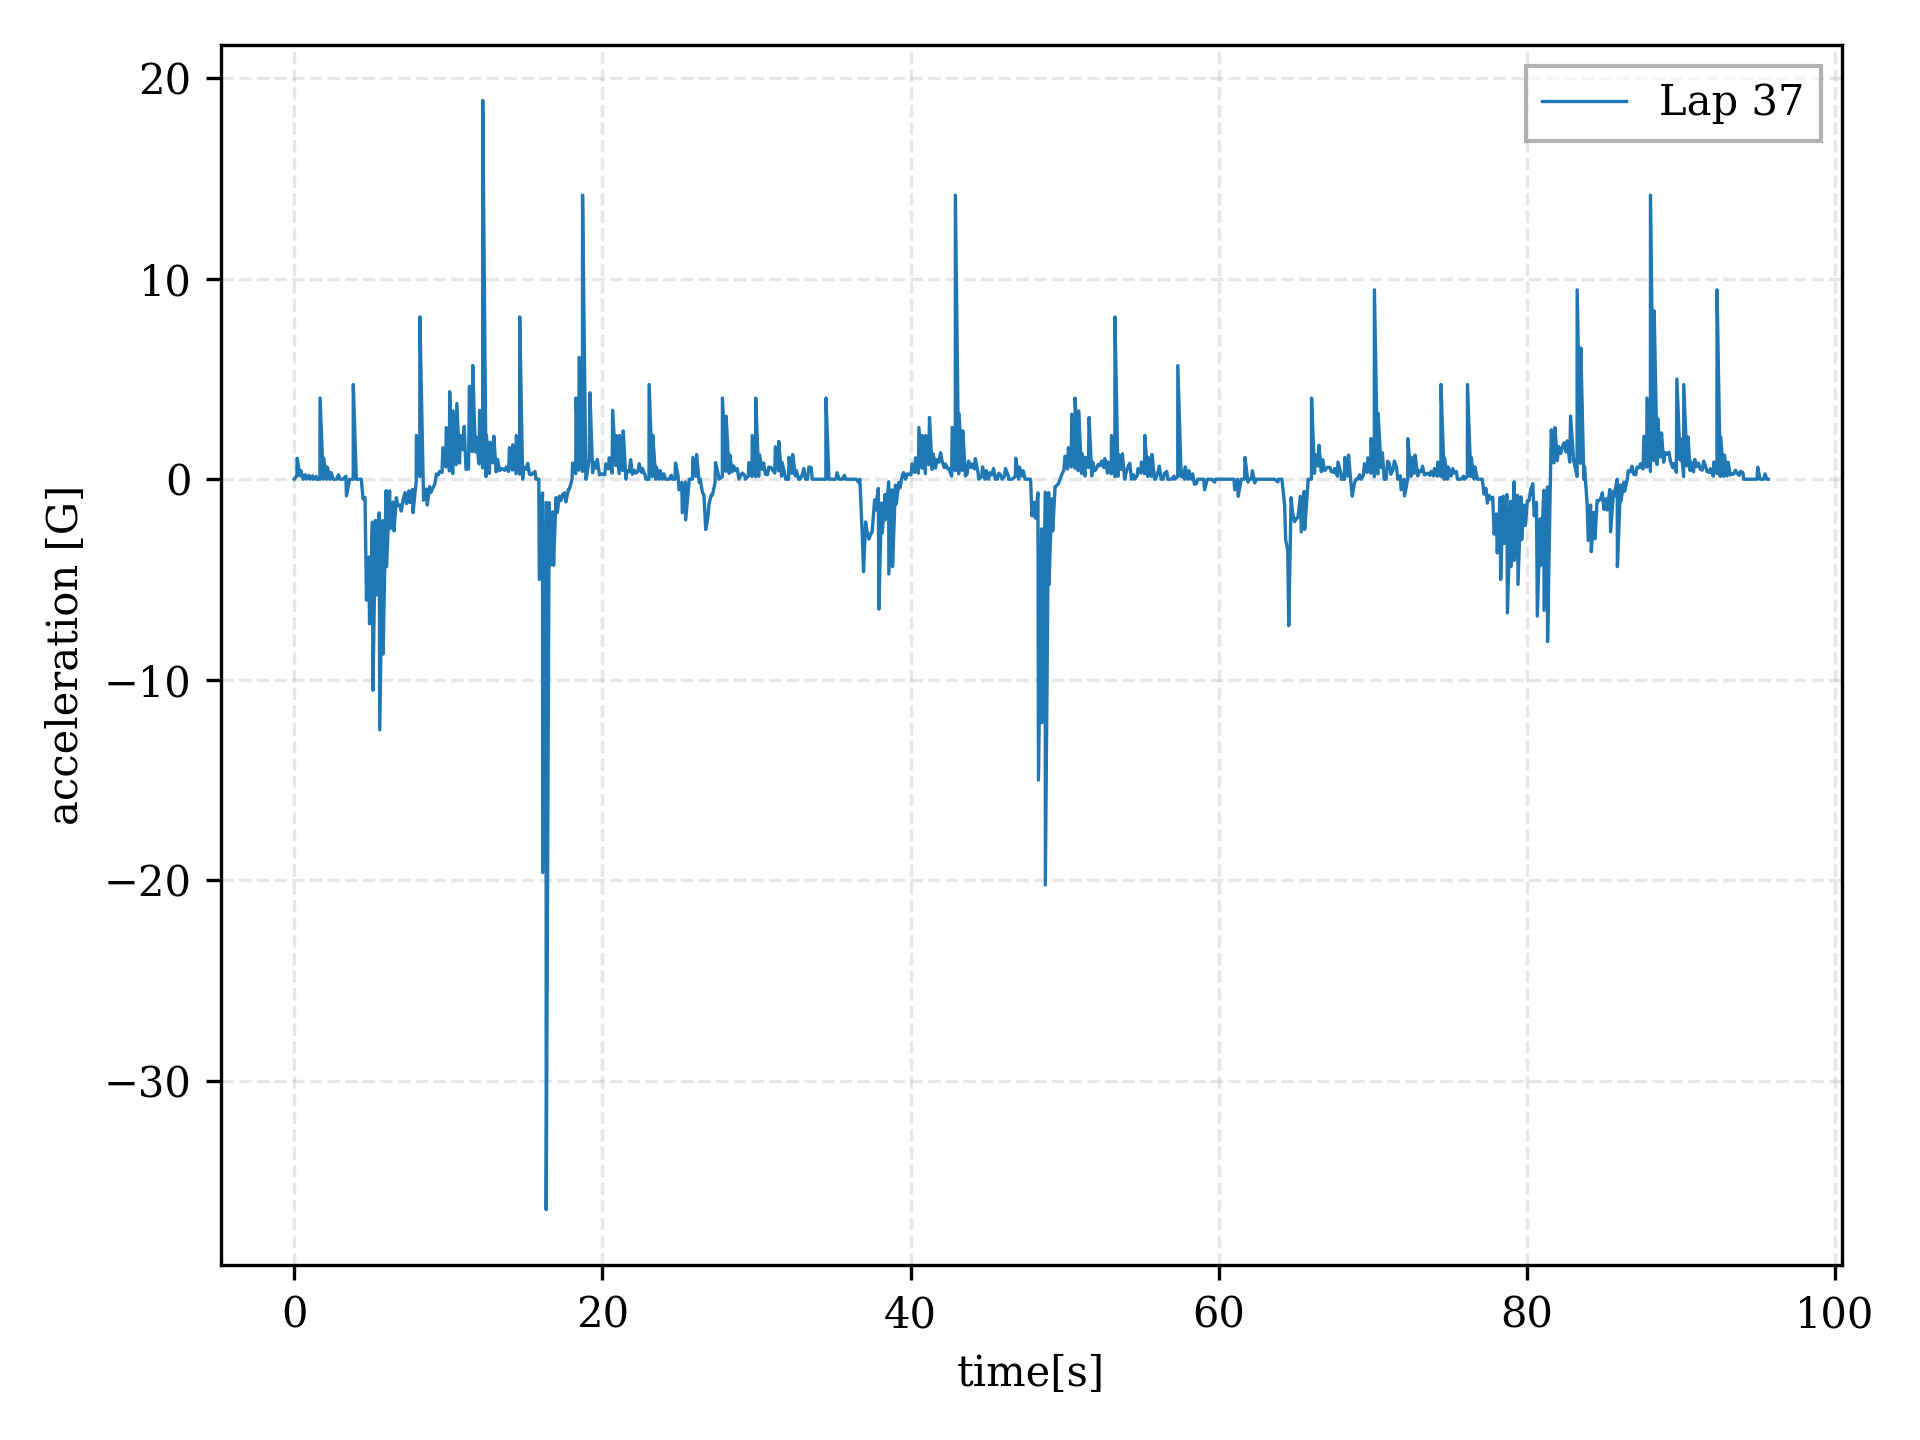
Presumably, car 33's acceleration plotted against it's laptime for lap 37.
Well… this plot is difficult to read, but let’s give it a shot. If we take the plot at face value, spikes in acceleration of over 30 G aren’t uncommon. After all there was no special occurrence around the 20 second mark of the lap that would have warranted such a large deceleration. In reality though, this is ridiculous. Taking a look at the wikipedia article “Orders of magnitude (acceleration)” [3] puts this value into perspective. Although F1 cars do experience very high acceleration and deceleration, for them to routinely experience over 20 G is unlikely. Let’s take a look at the same acceleration plot for lap 19 as a comparison.
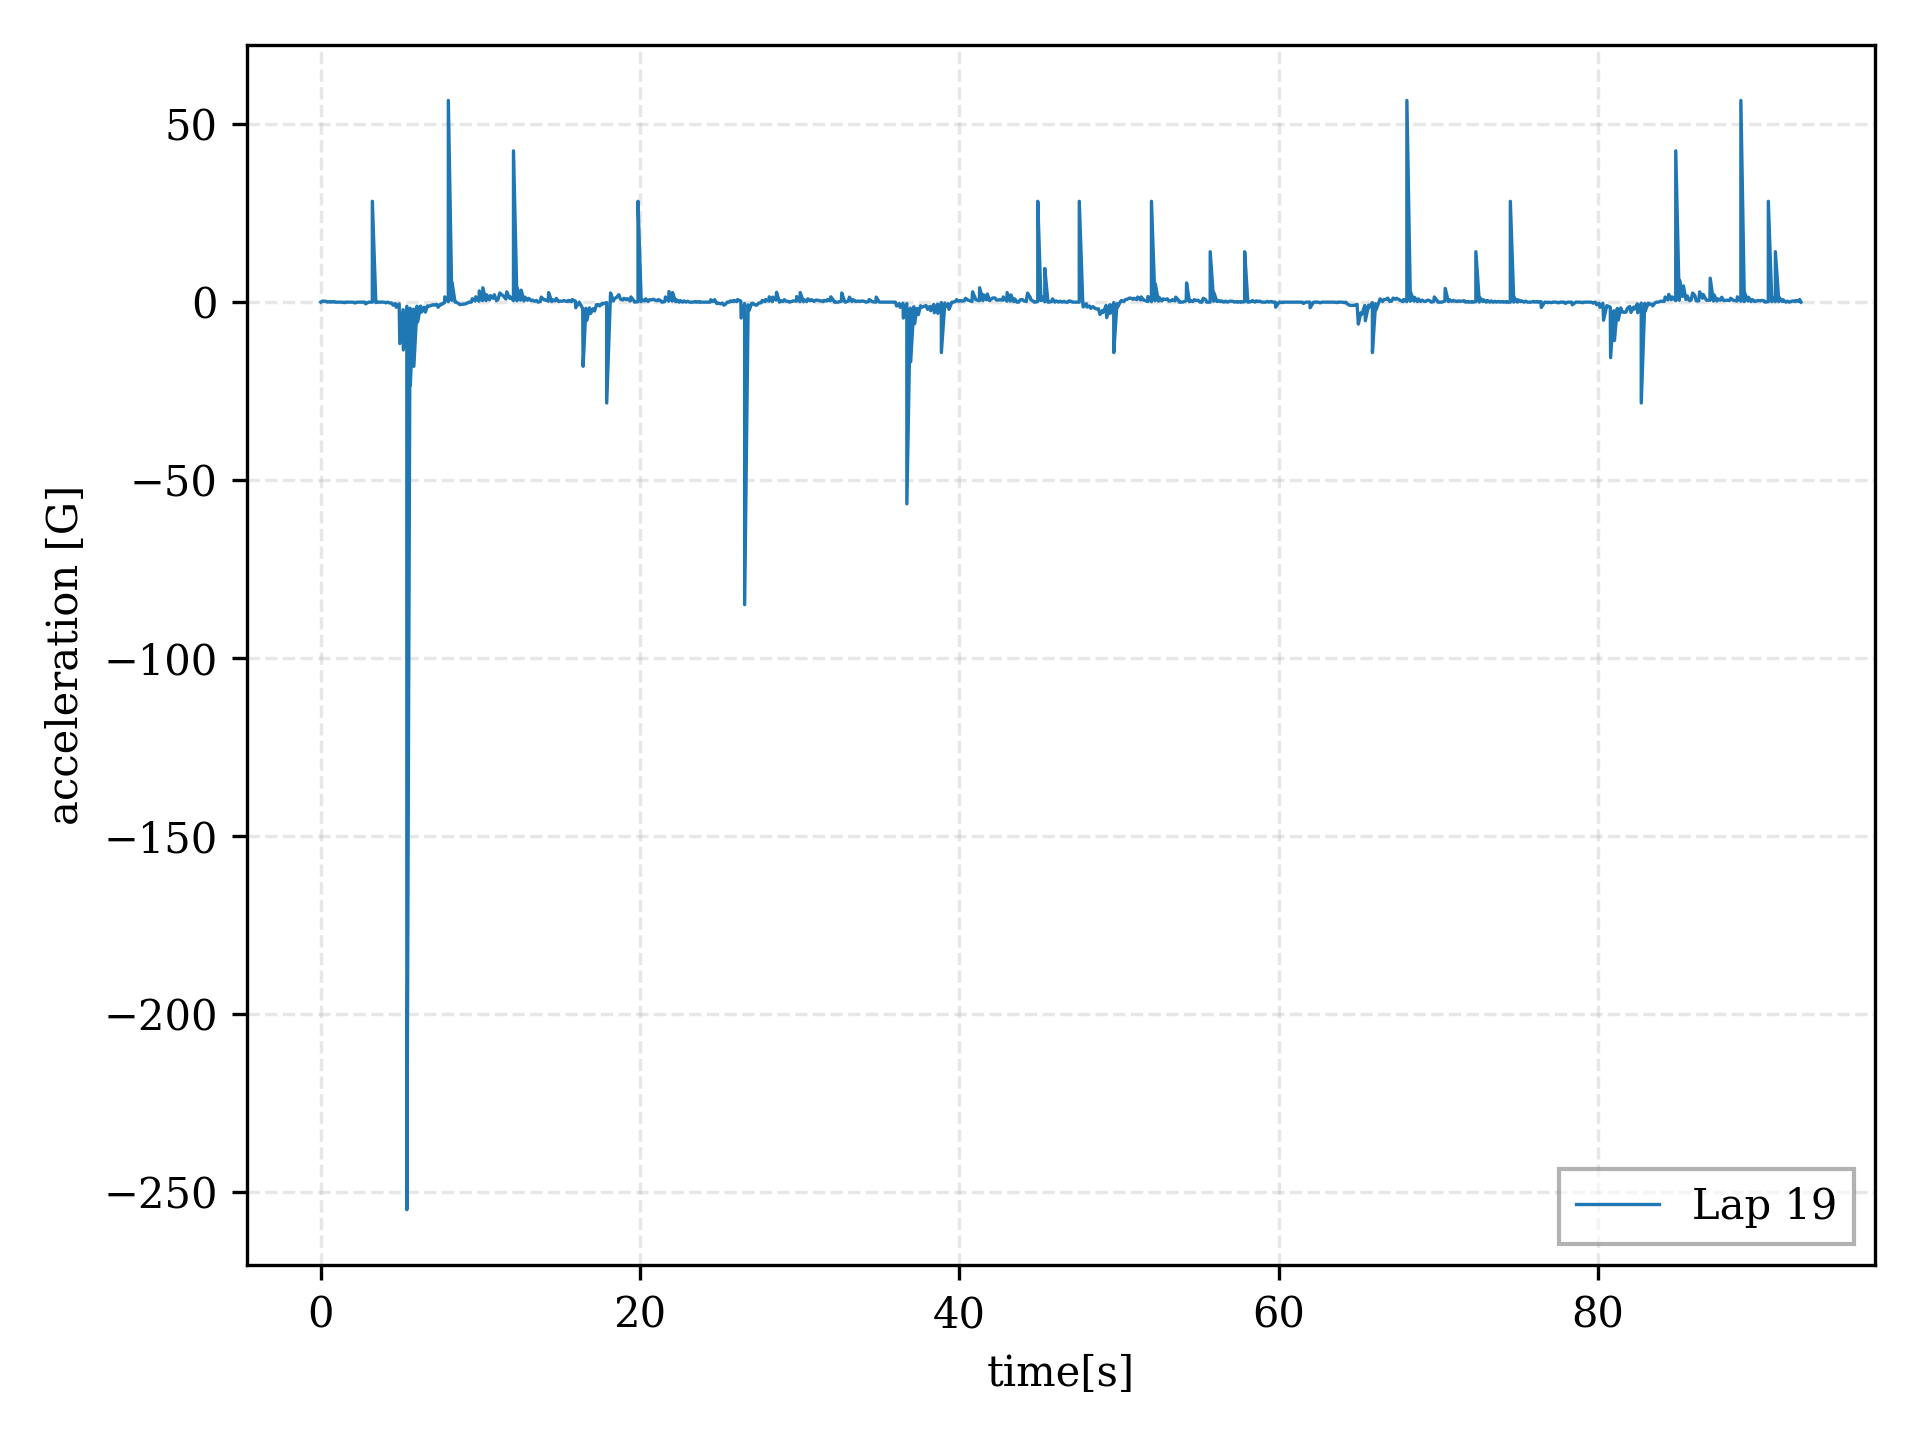
Presumably, car 33's acceleration plotted against it's laptime for lap 19.
This plot is even worse in terms of believability. Max’s car definitely did not experience a deceleration of more than 250 G. Obviously, something is wrong. I will continue to scrutinize my code in order to find any mistakes, however, besides this, one possibility is that the speed information provided by F1 through their API simply is not accurate enough for these kinds of calculations. theOehrly goes into this on a discussion on his github page [4]. Oh well.